


The Speedinvest Marketplaces & Consumer Marketplace Scorecard (Open Beta)


The Speedinvest Marketplaces & Consumer Marketplace Scorecard: How to evaluate marketplace businesses
At Speedinvest Marketplaces & Consumer, we invest in business models with network effects. Every year we search for 8–10 needles in the haystack — startups with the extra bit of potential vs. the countless other great companies we look at. Picking the winners can be a challenge with so many visionary founders out there. Many have promising business ideas and know how to pitch their start-up well. Hence, we often become excited about multiple investment opportunities in parallel. Yet, we have to ensure that our thinking is not only guided by subjective feelings but a disciplined, systematic approach. This is where our Startup Scorecard comes in handy. You can run through it in this Typeform or download it as an Excel File. The scorecard is an attempt to:
- align our approach of evaluating marketplaces deals
- come up with a holistic and balanced assessment
- base the assessment on as many objective and measurable criteria as possible
- make deals more comparable
- track and optimize our investment decisions alongside our own investment hypothesis
Why we have written this blog post
This article introduces our scorecard to
- provide you with transparent insights into our thinking
- to give all aspiring marketplace founders a tool to challenge the attractiveness of their idea (from a venture capitalist’s point of view)
- inspire your vision of how you can further develop your marketplace business
What the structure of the scorecard looks like at a high level
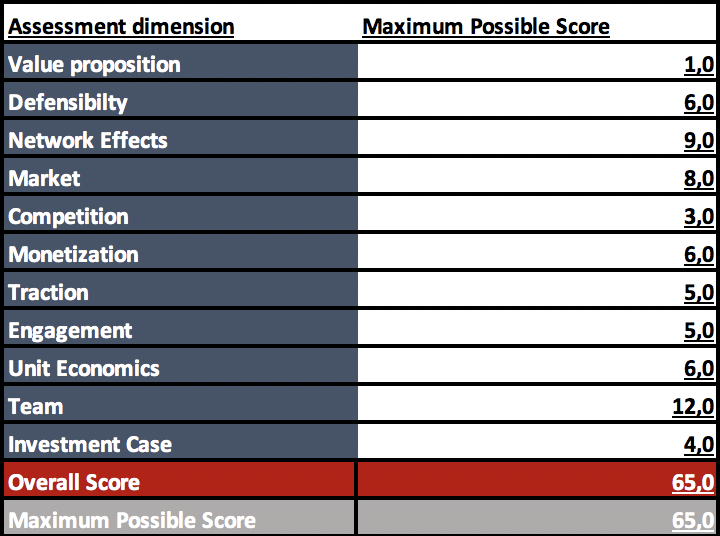
The scorecard consists of the 11 assessment dimensions displayed above: Value proposition, Defensibility, Network Effects, Market, Competition, Monetisation, Traction, Engagement, Unit Economics, Team, Investment Case. When we evaluate a shortlisted company with the scorecard, we attribute a certain number of points to each assessment dimension. The maximum number of points is 65 points.
Why our approach has limitations
Creating a comprehensive scorecard is a challenging, if not impossible, task because you have to make a trade-off between universal applicability and the level of depth of the tool. Moreover, the approach of applying objective and quantifiable assessment criteria has obvious limitations (e.g. when it comes to evaluating the product or the team). One last disclaimer: we have only recently developed the tool and so far, it has just been tested with a few dozen companies in our deal flow. What we know for certain is that it works best for typical marketplaces that already have some traction ( a typical stage for companies we invest in). For other businesses, (e.g., pre-seed stage companies, businesses with network effects but no marketplace), some evaluation criteria may not always be applicable.
After all, this will certainly not be the last iteration of the scorecard — in fact, we are very curious to get your feedback on how to tweak and improve it.
Now, let’s get to the gist of it.
Remark: The terms “marketplace”, “platform” and “business with network effects” are used interchangeably in this text

These are, in our view, considered to be the “hygiene factors” of any marketplace or network effects-driven business. These are the “must-haves” in order to make it into our short list. Most importantly, a marketplace has to offer (1) great quality of supply. No customer will buy in a marketplace if the supply is questionable or if better products can be found elsewhere (all else equal). It is also an excellent way of breaking into a market through a niche early on. The same is the case if the website does not enable an (2) intuitive user journey. Today’s users expect instant gratification. If they cannot find what they want easily or if they have problems maneuvering the categories, they will abandon the product and likely churn persistently. Next, the marketplace has to (3) facilitate trust. Users need to feel it is safe to transact through the website. The combination of these three factors, sometimes also referred to as the three pillars of marketplace success, have to result in a (4) new or much better user experience vs. the status quo. As Bill Gurley explains in one of his blog posts: “Great marketplaces do not simply aggregate a market; they enhance it. They leverage the connective tissue to offer the consumer a user experience that simply was not possible before the arrival of this new intermediary”. At the same time, the marketplace should also provide an (5) economic advantage to its users: the service becomes much cheaper for the customer (demand side) and/or the sellers (supply side) earn more money. Finally, whilst a start-up can claim that their marketplace meets all these requirements, we look for some extra validation and check if we can get (6) positive supplier and customer references.
A marketplace startup looking for seed-funding should check all these 6 boxes. If that is the case we attribute one point in our scorecard — not more because meeting these criteria is simply a hygiene factor Now you might think: What about a start-up that is pre-seed and has not launched the business yet? Well, then obviously it cannot fulfill all the criteria. It will just get one point less in the scorecard because it still has to prove it can make it.

When we analyze a marketplace business, we look for a number of indicators for future defensibility of the business, each worth one point in our scorecard.
- First mover advantage: Startups that are the first in their market are particularly attractive investment targets. They can capture market share quickly whilst building up brand recognition and customer loyalty before competitors enter the arena and hence create a moat around their business (also often referred to as the principle of “winner takes it all” or “winner takes most”). Examples of startups that benefited from a first-mover advantage include innovators such as Amazon (first online bookstore) and eBay (first notable auctioning website).
- Opportunity for tech to create value: An online marketplace becomes a stickier service offering if it does more than only matching supply and demand. Ideally, it has some tech features ingrained in its value proposition that a user would be willing to pay for even without conducting a transaction in the marketplace. One way to do that is to offer a SaaS solution either to the supply or to the demand side. Styleseat, a booking platform for hairstylists and beauty professionals, is such a SaaS-enabled marketplace. It provides the professionals with a software to manage their bookings and other administrative tasks such a lightweight CRM-solution to manage their clients. Another way to leverage technology is to create APIs to the supplier-side or customer-side. In a marketplace for construction goods you could for example link to the ERP-system of the suppliers and to the project management software of the construction companies.
- Opportunity to gather unique data with commercial value: Unique data means unique value a company can provide — and, as a result, significant demand for this kind of data exists (or will exist). Xeneta, a marketplace for sea freight containers, has taken advantage of the vast amount of transaction data on their platform to build up the world’s largest ocean freight rate database. A lot of the value lies in structuring previously unstructured data. German metals trading platform Mapudo operates in a market with 200.000 SKUs and is in the process of collecting and standardizing information about all these SKUs in its database. It can thereby provide its customers with unknown transparency about the products on offer in the market.
- Community: A great way to get users engaged and grow a loyal user base is to turn a platform into something more than a marketplace: a community. Some of the most successful marketplaces, like AirBnB and Etsy, have successfully pursued this strategy.
- Customer or supplier lock-in: If customers or suppliers can be locked into the service by contracts, value-add services, SaaS, APIs or other means, that creates a deep moat around the business. Suppliers of a marketplace are hardly going to switch to a competitor if they use a SaaS tool from the marketplace that is deeply ingrained in their daily workflow. Other than that, the more value-add the SaaS tool provides, the less attractive bypassing becomes. Platforms like Apple’s AppStore or Google’s PlayStore also do a formidable job in this context by hosting content and apps that can’t be transferred elsewhere. Customers who switch from one app store to another typically lose all their apps and data.
- Very high customers satisfaction: What does very high mean in this context? We believe NPS is one of the best and simplest tools to measure customer satisfaction and give one point for an NPS score above 50. Alternatively, we also give one point for e.g. a Trustpilot ranking of more than 9 (or similar services such as eKomi etc,).
You might wonder why the list above excludes network effects. It is because they are an inherent feature of all marketplaces, with varying strength. Network effects are so important to our investment hypothesis, that we have covered them as a separate section of the scorecard.

How do you measure network effects? This is a question that can be debated at length. There is no obvious answer. However, we believe that by combining different type of network effects you can create even stronger network effects (for a more theoretical deep-dive on different types of network effects, we recommend reading this great article by Nfx). Moreover, there are some good indicators for the strength of network effects, like a high “buyer equals seller” ratio. We value each of the points listed below with one point in the scorecard.
- Direct network effects: Direct network effects are very strong because each new member in the network increases the value of the network for all other members of the network. The typical examples of companies with direct network effects are social networks and communication platforms such as Facebook, Instagram, WhatsApp or Skype.
- Two-sided network effects: Marketplaces and platform businesses have 2-sided network effects. Every new supplier on a marketplace adds value to the customers and vice versa. Some businesses create a powerful combination of direct and two-sided network effects, such as Facebook for example. Facebook is a social network connecting users, but at the same time it is a marketplace allowing advertisers and to target the members of the network.
- N-sided network effects: Collaboration in n-sided markets often happens around a project, e.g. a construction site (e.g. via Building Connected) or an event (e.g. via Honeybook), connecting many parties who have previously communicated and transacted offline. Another example is AngelList, a company that facilitates interactions between founders, employees, investors, advisors, and recruiters, with a specific start-up usually being at the center of these interactions.
- Data network effects: Marketplaces with vast amounts of user data can generate strong data network effects. Ebay or Amazon, for example, have built strong recommendation engines for their products. They are based on the comparison of the user behavior of millions of their website visitors. Other marketplaces feed an AI with image data. Photo trading platform Eyem uses image recognition algorithms to predict how well a certain image is going to sell on the platform. The more images and data are fed into the algorithm, the better the predictions.
- Transregional network effects: All things equal, we prefer transregional network effects over local network effects. Every new flat of AirBnB is a benefit to all users of the platform, whilst every newly listed item on a peer-to-peer lending platform for neighbors is only a benefit for people living in close proximity. The hyper-local business model is much harder to scale.
- Indirect network effects and/or community: Indirect network effects can be defined in different ways. What we mean in this context, is that the users of a marketplace or other third-party companies start building products or services around the marketplace, e.g. concierge services for AirBnB. Indirect network effects also arise when customers start communicating with each other unrelated to a specific transaction, often in a community-like format.
- Buyer = seller ratio is higher than 5% (5% is an arbitrary threshold). The beauty of peer-2-peer marketplaces is that buyers often become sellers and likewise. On eBay, many of the buyers have also tried selling an item on the platform and vice versa.
- 3-month growth rate of active users from organic traffic higher than from paid traffic: Growth figures can be misleading if growth is mostly stimulated by paid marketing. As Andrew Chen has brilliantly pointed out, start-ups can die from their addiction to paid marketing. When organic traffic outgrows paid traffic, however, it can be assumed that word of mouth is good, and multipliers are spreading positive news about the business. This has been the case for practically any successful social network in the past.
- Virality coefficient of at least 0,25 (every fourth customer brings at least one new customer). Many startups give their users the opportunity to send out invitations to other users via a referral program. The users who send out these invitations do so either because they are incentivized by a referral bonus, or simply because they would benefit from the presence of the referred customer on the platform. Uber, for example, builds referrals into its product — assigning each customer a personalized referral code. Whilst we do not know their actual virality co-efficient, we think they have simple, yet smart referral system in place. Every time a new account is created using the code, both the referring and the new customer get their next Uber trip free.

Similar to any other VC investor, we love startups that tackle big problems in huge markets. Ideally, the companies we invest in have a total addressable market (TAM) of more than 50 billion euro (this will yield the max score of 5 points in our scorecard). However, many companies we see address a much smaller market. We cannot consider all of them, because, like most other VCs, we need to invest in startups which can, at a successful exit, at least return the entire fund. In our view, a TAM as low as 1–2 bn Euros can still yield a large enough financial outcome provided that a) the company’s take rate is high and b) it has the potential to capture significant market share. Yet, we would be very careful investing in a business with such a small TAM, since it will have a much harder time attracting follow-on funding from bigger funds with higher TAM requirements.
Some start-ups create businesses in markets that have not existed before or, they unlock shadow markets (like Uber and Airbnb did). In these cases, TAM might be well below 1bn dollars. We would consider an investment in startups addressing such markets if we are convinced that the market size can grow to multi-billion dollars within a reasonable timeframe (of 5 to 7 years). As the cases of Uber and Airbnb show, new or unlocked shadow markets can actually be extremely attractive. On the other hand, Google made a big bet that Google Glass would open up a new market, but we have yet to see this materialize. We allocate three points to startups opening up new, not yet existing markets with a significant potential market size (10bn plus to justify the additional risk).
Market growth is another important factor to determine the attractiveness of a market. Markets that grow faster than 5% annually get an extra point on our scorecard. Shrinking markets get a minus point.
Another aspect to consider is the fragmentation of a market on the supplier- as well as the buyer-side. The more fragmented a market is, the more value-add a marketplace can provide. In markets with too little fragmentation, individual market participants can gain too much power and dictate terms. Moreover, bypassing becomes a serious risk. It is hard to find a universal threshold when a market is enough fragmented. Generally, we hope to see several hundred or even thousands of suppliers and ten thousands of customers. At the same time, it is important to look at transactions at an individual level. In our view, if there are usually at least 10 potentially relevant transaction partners for both buyers and suppliers, no individual player has too much power and bypassing becomes quite cumbersome. Which buyer wants to write emails back and forth with 10 suppliers? If there are less than 10 relevant transaction partners, we give a minus point (and might not invest at all).

We prefer to back startups that have no competitors with a similar business model yet (3 points in our scorecard), at least not in Europe. As you might have noticed, we have already valued “first mover advantages” in the section on defensibility. We feel that overweighting this point is justified due to the large benefits associated with being a first mover.
We do, of course, evaluate startups that have to face competitors with similar business models and similar funding (we then give 2 points) or even better funding (1 point). The positive side of competition is that it is a good indicator that the market is attractive. Being late just makes it harder to be successful, although sometimes there also some late mover advantages, e.g. less product validation is required.

Marketplaces have entirely different revenue margins. Most marketplaces monetize mainly through a “commission model”. In his classic blog post, A Rake Too Far: Optimal Platform Pricing Strategy, Billy Gurley presents a handy table comparing the take rates of several successful marketplaces. Here you can see that a company like Open Table can thrive with a take rate as low as 2%, whilst image platforms like Shutterstock manage to take a 70% cut from each transaction. However, all things being equal, the higher the revenue margin of a platform, the better. That’s why in our scorecard we give 3 points to platforms with a revenue margin of more than 25% and fewer points for lower margins.
In general, it is also easier for a marketplace to become successful when the purchasing (or usage) frequency is high. Customers are more engaged and keep the product on top of their mind. We give one extra point for a marketplace with at least medium purchasing or usage frequency — which we have defined as a marketplace that is relevant for the customer at least once per month.
Another extra point is given when a marketplace has the potential to develop several different monetization options, e.g. commission, listing fee, add-on services, advertisement (more on this here). More monetization options mean greater pricing flexibility for a platform and a higher likelihood of extracting the maximum amount of value (i.e. take rate) in the long-term.

When we talk about traction, different metrics make sense for different types of businesses at different stages. Usually, we are interested in Gross Merchandise Volume (GMV) growth. However, there are certain businesses with network effects for which user growth matters much more than GMV in the early stages of the company life, e.g. social networks. In the scorecard, we always take into an account and evaluate the most meaningful metric.
We also differentiate regarding the evaluation period (i.e. timeframe). If a company has been on the market for more than a year, we look at GMV growth in the last 12 months. We give a top score of 5 points if GMV has grown by more than 5x. Anything above 3x yearly growth means the company is on track to follow the mantra of “Triple, triple, double, double, double” (T2T3), coined by Neeraj Agrawal from Battery Ventures. T2T3 should be the ambition level of every startup that wants to become a billion-dollar company.
As a seed investor, we get many pitch decks from companies, that have been on the market for less than 12 months. In these cases, we cannot calculate a year-on-year growth-multiple. Instead, we take the startups compound monthly growth rate of the last 4 months. Doing so only makes sense if in month one of the evaluation period GMV has crossed a minimum threshold of at least 10k EUR or USD. Otherwise, we look at a base figure so low that the calculated growth rate is artificially inflated and hence meaningless.
There is yet another situation where we would only consider the most recent months of growth even if a start-up has been on the market for one year or more. That situation is given when a startup has recently pivoted and is gaining traction rapidly due to the changes in strategy.

Often, user engagement is a superior indicator of success than financial traction for early stage marketplace companies. There are several ways to measure user engagement. Tracking purchasing frequency is one of them, but a KPI like the number of repeat purchases is just of limited value. What qualifies as a high or low number, is totally depended on the business model.
We have therefore decided to measure engagement by looking at the share of wallet. Let’s take a marketplace for catering services as an example. Here, we would look at how much of the catering order volume of the customer is funneled through the platform after the first transaction. We give a max score of 4 points if more than 80% of the customer’s order volume is captured by the platform after becoming a customer.
A great indicator of early product-market-fit is the emergence of power users. Power users can also help a startup to understand in which direction to develop their product and strategy. For the sake of the scorecard, we assume that a power user is someone who spends more money or time on the platform than he did before on this specific use case. A power user of a catering marketplace, for example, would be a company that orders catering more often than it did before using the services of the marketplace. The scorecard honors the emergence of power users with one extra point.

When analyzing the unit economics of a startup, it is important to differentiate whether the business is by nature a business with recurring revenues (e.g. a subscription business) or mostly non-recurring revenues (e.g. a platform for buying houses).
If it is a “natural retention business” we analyze the ratio of customer lifetime value (CLTV) vs. “fully loaded” customer acquisition costs (CAC). CLTV is calculated as follows:
Average revenue per transaction x gross margin x the average number of transactions per customer over its entire (average) lifetime.
Fully loaded CAC should include all costs to convert a (new) customer, including performance marketing, attributable sales costs, attributable customer success costs, and other marketing costs. When talking about unit economics with startups, we often hear very bold assumptions regarding customer retention, resulting in an inflated CLTV. To be on the safe side, we assume a customer lifetime cut-off point of 18 months for B2C-businesses and 36 months for B2B-business (reflecting the often longer-enduring business relationships in B2B-businesses).
If revenues of the business are not recurring on a regular basis, but only once or every other year, we instead analyze gross margin vs. costs per order (CPO). We hence assume that a customer has to be newly acquired for each purchase and it is absolutely essential that the business is first order profitable.
As a rule of thumb, we would like to see a CLTV vs. CAC ratio or, alternatively, a gross margin vs. CPO-ratio of at least 3 to 1. For a ratio above 4 to 1, we give a top score of 3. In the case that unit economics are not yet existent we work with estimations and make our own predictions to test whether a healthy ratio is achievable at all for the company in question.
Customer retention of businesses with recurring revenues is often hard to predict, especially at a very early stage of a company. Therefore, we look at another KPI that is usually easier to determine: the payback period. The payback period stands for the time it takes to recoup the customer acquisition costs. Customers with non-recurring revenue should always be first order profitable. B2C businesses with recurring revenues get an extra point if the payback time is less than 6 months, B2B businesses get an extra point if the payback is less than 12 months. Companies with recurring businesses who are first order profitable receive an additional extra point.
Lastly, we want to be confident that the customer and supplier acquisition strategy is scalable. In order to do that we need to look at the different acquisition channels and their dynamics. Optimally, the company has found at least one organic acquisition channel that can fuel growth in the long run. If paid marketing is the main customer acquisition strategy, we try to evaluate if CAC will remain at an attractive level whilst increasing marketing spend.

William A. Sahlman of Harvard Business School has well summarized a common mentality amongst investors: “When I receive a business plan, I always read the résumé section first. Not because the people part of the new venture is most important, but because without the right team, none of the other parts really matter”.
We could not agree more, so we overweighted the “Team” section in our scorecard. Teams are being assessed along 12 success factors of exceptional founder-teams. One point is given for every success factor that is met.
- Multi-founder set-up: Some of the most successful companies in the world have been founded by a single founder (e.g. Amazon, Facebook). Also, data shows you don’t actually need a co-founder. Still, we try to avoid investing in a single-founder setup. From an investor’s point of view, it is simply riskier. Paul Graham of Y Combinator even suggests that solo-founded startups are the №1 one mistake that kills a startup.
- Founder/C-level team is highly complementary, covering all business-relevant skills: One investment banker and one former management consultant might have a complementary skill set, but they probably lack some skills that are relevant for building up a marketplace (e.g. that of a CTO or CPO). So what we look for are founding teams with a complementary skill set that truly covers all business skills we deem relevant.
- One founder/C-level has held a founder/C-level position in at least two startups: We value start-up experience. There are studies that come to different conclusions on whether serial founders are more successful than first-time founders. Our observation is that experienced founders are more likely to succeed. We also think there is some truth in “third times charm”: having a team member who has founded two previous companies can help them avoid crucial mistakes and become successful quicker.
- One founder/C-Level has had a previous successful exit of more than €10M: A previous exit of significant size is a strong indicator of the execution capability of a founder. Why €10M, you might wonder? Well, that’s an exit large enough to be meaningful, but of course, it is an arbitrary threshold.
- One founder/C-level has more than 5 years of sector experience: Again, 5 years of experience is a somewhat arbitrary threshold. What is important, is that deep sector expertise in the team will increase the speed of the startup. The dynamics of the market and the needs of the market participants are well understood. Costly mistakes can be avoided. In our view, this is particularly important in a B2B-business.
- Team has such high drive/energy level that is it makes you feel slightly uneasy: The higher the drive of a team, the quicker the progress of the start-up.
- You have the feeling the team could sell anything, even sand in the desert: Particularly at seed stage, founders largely cannot afford to hire an experienced Head of Sales or CSO. It’s up to the founders to sell their product, so having a founder with sales DNA is a big plus. Besides, we believe that founders need to be, above all, good at “selling”; They need to sell to their pot. customers, to pot. business partners, to their own team (for hiring and to motivate staff) and to pot. follow-on investors.
- You have the feeling the team could manage hundreds of people: It is easy to confuse competency with leadership skills. Most founders we talk to come across as highly competent and capable. Yet, not all are natural born leaders. That fact might remain hidden when the team is small, and hierarchies barely exist. But, it will surface when the headcount grows to dozens of people.
- Team is keen to learn and open to feedback / advice: Winston Churchill said: “I am always ready to learn although I do not always like being taught”. As a VC, we never teach founders, but we do think we can offer some good feedback and advice (and if in a particular situation we can’t, we will do our best to find someone who can!). During the due diligence, we already get a good sense of whether the founders are open to feedback or not.
- Team has 10x mindset (visionary): The philosophy of 10x is woven into Google’s DNA. Always think big. Very big. Build products and services that can change the world. That very ambition level is exactly what we hope to see in a strong founding team.
- Team has excellent references: There is only a limited amount of information you can gather about a founding team in the few interactions that eventually lead to an investment. To be on the safe side, we check if our positive impressions of the team are also validated by references from people who have worked with the founders in the past.
- You would personally like to work with the founders: If we cannot answer the question with yes, we are very concerned. Why would anyone else want to work with the founders? We need to find a good answer or wave a big red flag.

Even if our assessment makes us very bullish about a company and its team the investment round still has to make sense from an economic perspective. In our scorecard, we give a point each if the subsequent criteria are fulfilled:
- Min. stake of 15% possible whilst the valuation reflects stage and traction of the company: As a VC fund you are constantly looking for outlier companies, the rare (potential) unicorns. The typical VC fund economics dictate that you need to find these outliers and to have a meaningful stake in the company in order to deliver an attractive ROI on the fund. You do not want to end up with 1% share when your portfolio company hits the 1bn dollar valuation. That’s why aim for at least 10% equity share in our investments and give one extra point if we can get 20% or more.
- Validation through top-tier co-investors/angels: First and foremost, we develop our own conviction for every potential investment / company. So what would happen if we are bullish about a startup investment, but many other VCs that we respect have already passed on the opportunity? We would certainly trust our own due diligence and do the investment. Now, what if we are bullish about a startup investment and 5 other top VCs also want to invest? Well, it is hard to deny that we would feel even more confident about doing the investment :-)
- Cap Table Ok: Founders/Mgmt. own more than 60% of the company post-money incl. ESOP: Most successful startups need a lot more money after their seed-investments to finance their growth. These investments will be provided by investors who will equally claim their fair share in the equity of the company. For that reason, the founders and the management should always own at least 60% of the company post-money incl. ESOP after our investment round. This will ensure that they still have room to dilute their equity in future rounds whilst keeping a large enough stake to remain financially incentivized and motivated.
- Signaling: No existing investors with “deep pockets” refrain from their pro-rata rights. If some business angels cannot afford to participate in much larger seed rounds, that’s ok and totally fine with us. But, if a wealthy investor, who does similarly size follow-on rounds, refrains from the pro-rata, that is a big concern and means negative signaling to the rest of the market.
That’s it. We have now gone through the entire scorecard. We hope this article helps to explain our thinking around marketplaces. We also hope the scorecard serves as a useful tool for marketplace founders to evaluate how “VC ready” their business is — in our experience, most interesting marketplace start-ups have a score of at least 30.
If you want to run through the scorecard yourself fill out this typeform or download this Excel File.
Again, please do not hesitate to reach out to let us hear your thoughts on this. Happy also to discuss during the marketplace conference that we organize on the 28th of November in Berlin — make sure to get some tickets before they are sold out.

Learn more about the Speedinvest Marketplaces & Consumer team and sign up for our newsletters to get our exclusive content delivered straight to your inbox.


.svg)
